Tracking Weather Balloons
What are the chances of receiving a radio signal
from a 100 milliwatt transmitter at a frequency of 400 MHz and distance
of 240 km
(150 miles)? Slim to none, I thought. But what if the transmit antenna
were at the height of Mount Everest? Hmm. That might require a bit of
calculation.
 Weather balloons soar far above the highest clouds, nearly halfway to
where space begins. Of course, neither the height of the highest
clouds nor the boundary between earth’s atmosphere and space is a
precise measure. — On their return journey, when the balloons
burst and then parachute to earth, the chance of one landing on your
head is less than the chance of winning the power-ball drawing. They
often land in wilderness, nearly inaccessible places, and sometimes go
to sea.
Weather balloons soar far above the highest clouds, nearly halfway to
where space begins. Of course, neither the height of the highest
clouds nor the boundary between earth’s atmosphere and space is a
precise measure. — On their return journey, when the balloons
burst and then parachute to earth, the chance of one landing on your
head is less than the chance of winning the power-ball drawing. They
often land in wilderness, nearly inaccessible places, and sometimes go
to sea.
My introduction to weather balloon tracking came
about in an off-hand way. While at lunch with ham radio friends, I
overheard a
conversation from the far end of the table. One of the hams (John
K4AXV) was telling about receiving signals from weather balloons. “What
frequency was that, John?” — 403.61
MHz was the reply. That was the frequency of the Charleston South Carolina balloon at
the time, and still is, as of this writing.1
The US National Weather Service launches a
balloon from the
Charleston Air Force Base twice daily, at 7 AM and 7 PM
local time (currently 1100 and 2300 UT). Other regional launch sites
include
Atlanta GA, Greensboro NC, and Jacksonville, FL.
First detection:
A few days after learning of its existence, and after a mix-up or two
that will be omitted from this
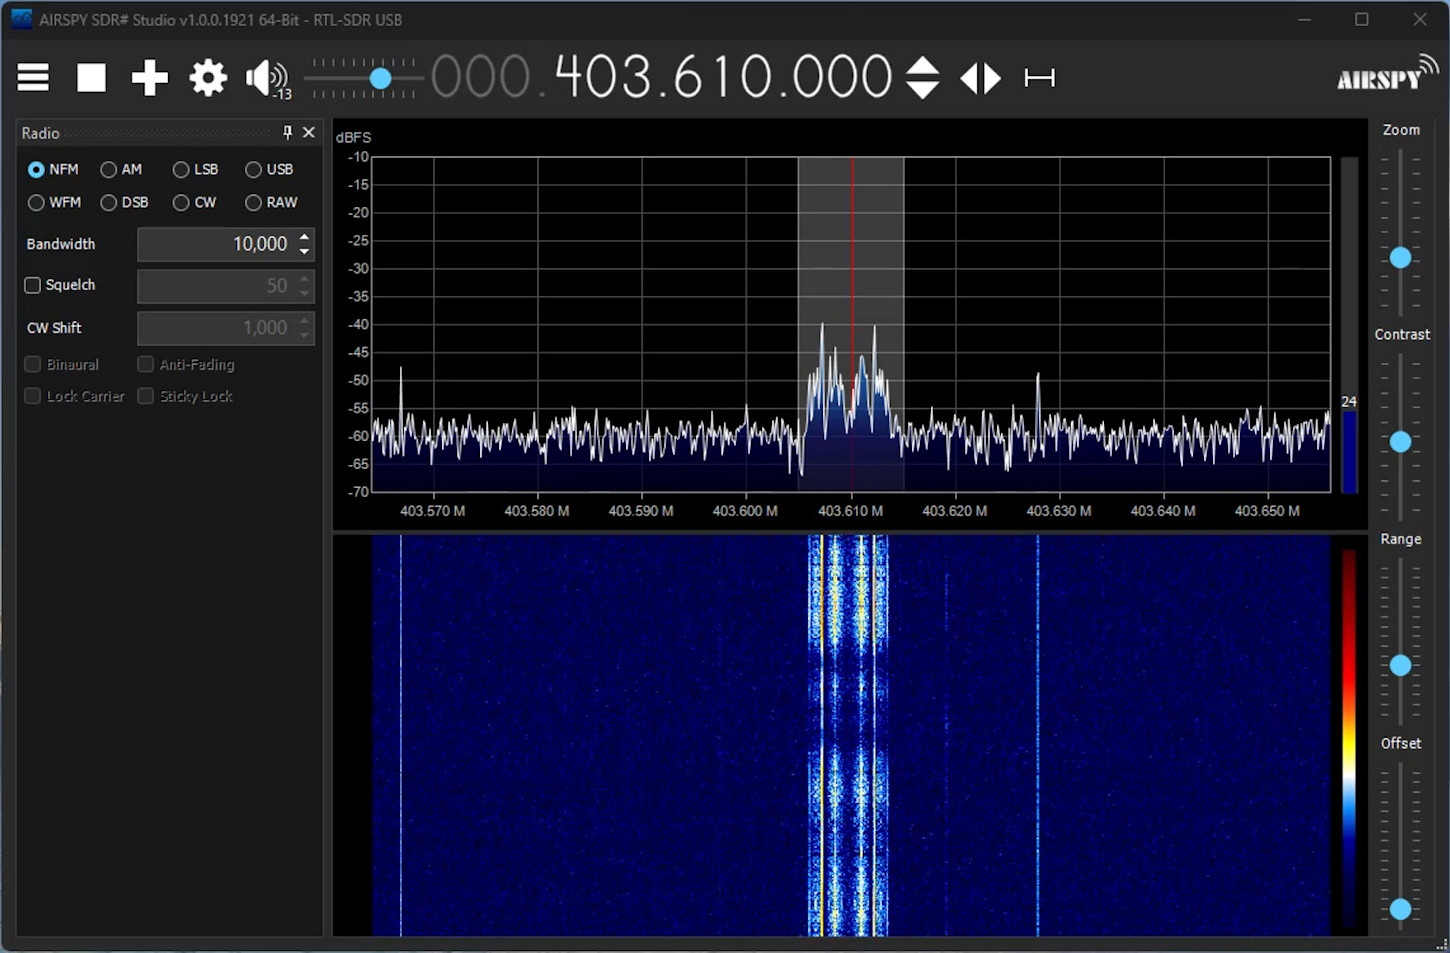
narrative, I heard the Charleston Balloon for the first time. The
receiving setup consisted of an RTL-SDR dongle connected to a homemade
ground plane antenna that was loosely based on this one (design 3), with SDRSharp (SDR#)
as the user interface. Prior to receiving the radiosonde signal, I was
not sure of the transmission mode (NFM 10kHz bandwidth). Thus,
tuning-in
the signal was not merely thrilling—it was useful as well. I have
uploaded a 30-second clip (video and sound) of SDR#
receiving the balloon on Aug 4, 2025.
In my imagination I attributed the QSB (fading-in and -out) to the
radiosonde and its
antenna being buffeted by wind, but that was nothing more than a guess.
 Decoding Telemetry: As pleasing as it was to hear a few
tones from the
balloon, with what seemed to be a once-per-second
drum beat,
the next obvious step would be to extract some sort of meaning from the
tones. My Internet search for an “SDR# radiosonde decoder plug-in” did
not succeed.
Instead among the search results was a full-featured decoding
application called radiosonde auto_rx. A detailed guide to
installation and setup may be found at its github wiki page. At this point I set about to install
the application on a
Raspberry Pi 3B.
Decoding Telemetry: As pleasing as it was to hear a few
tones from the
balloon, with what seemed to be a once-per-second
drum beat,
the next obvious step would be to extract some sort of meaning from the
tones. My Internet search for an “SDR# radiosonde decoder plug-in” did
not succeed.
Instead among the search results was a full-featured decoding
application called radiosonde auto_rx. A detailed guide to
installation and setup may be found at its github wiki page. At this point I set about to install
the application on a
Raspberry Pi 3B.
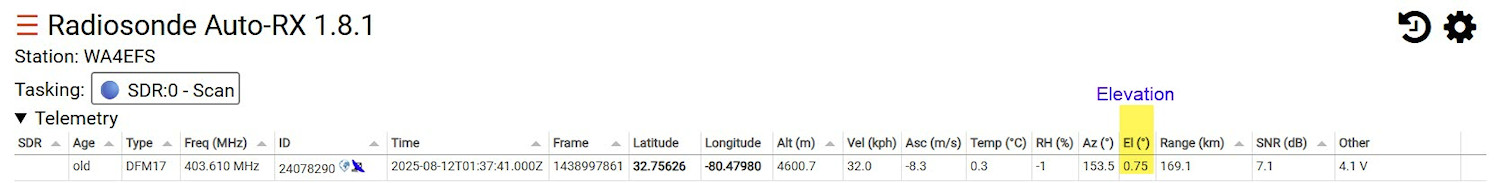
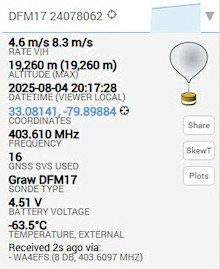
Something is better than nothing. My setup did not
decode many packets on that first go, but it did upload a few telemetry
records to sondehub.org,
where, to my gratification, they were attributed to callsign WA4EFS
(right). Sondehub.org is the premier web site for balloon tracking
world-wide. Sondehub not only displays a great many balloon tracks in
real time, it also summarizes uploaded data in easy-to-grasp ways, and
makes composite telemetry and station data available for download—Not
all its useful features are immediately apparent, however, or perhaps
the obvious escapes notice.
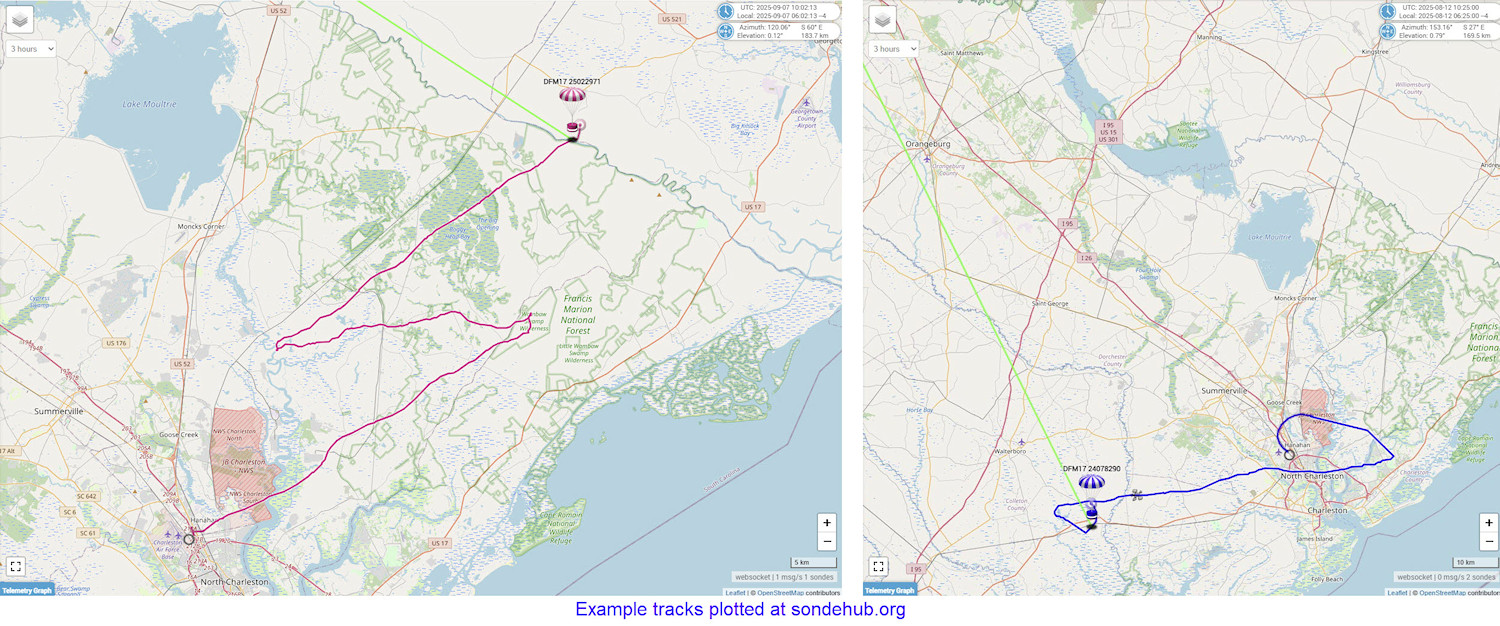
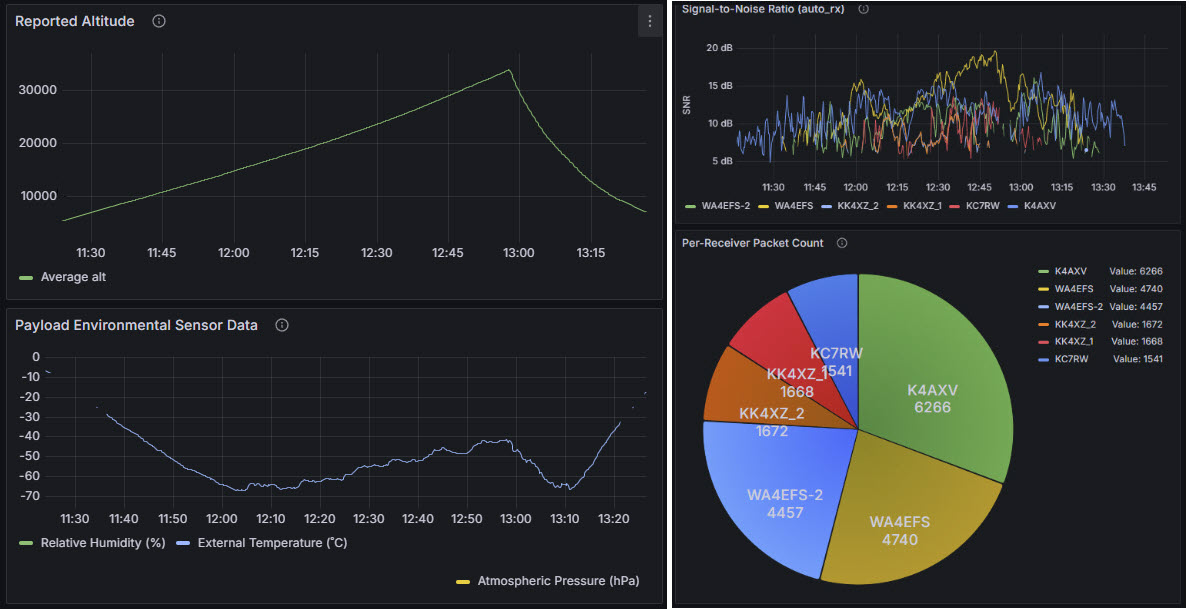
Sondehub plots:
After at least a week
of observing the Charleston balloon track take shape twice daily at
sondehub.org, my eye fell on a button labeled “Plots.” Clicking this
button opened a page of exceptionally rich content. There were many
graphs, some summarizing balloon radiosonde data and others showing
contributor data, such as received signal-to-noise ratios and numbers
of
telemetry packets uploaded (pi chart).
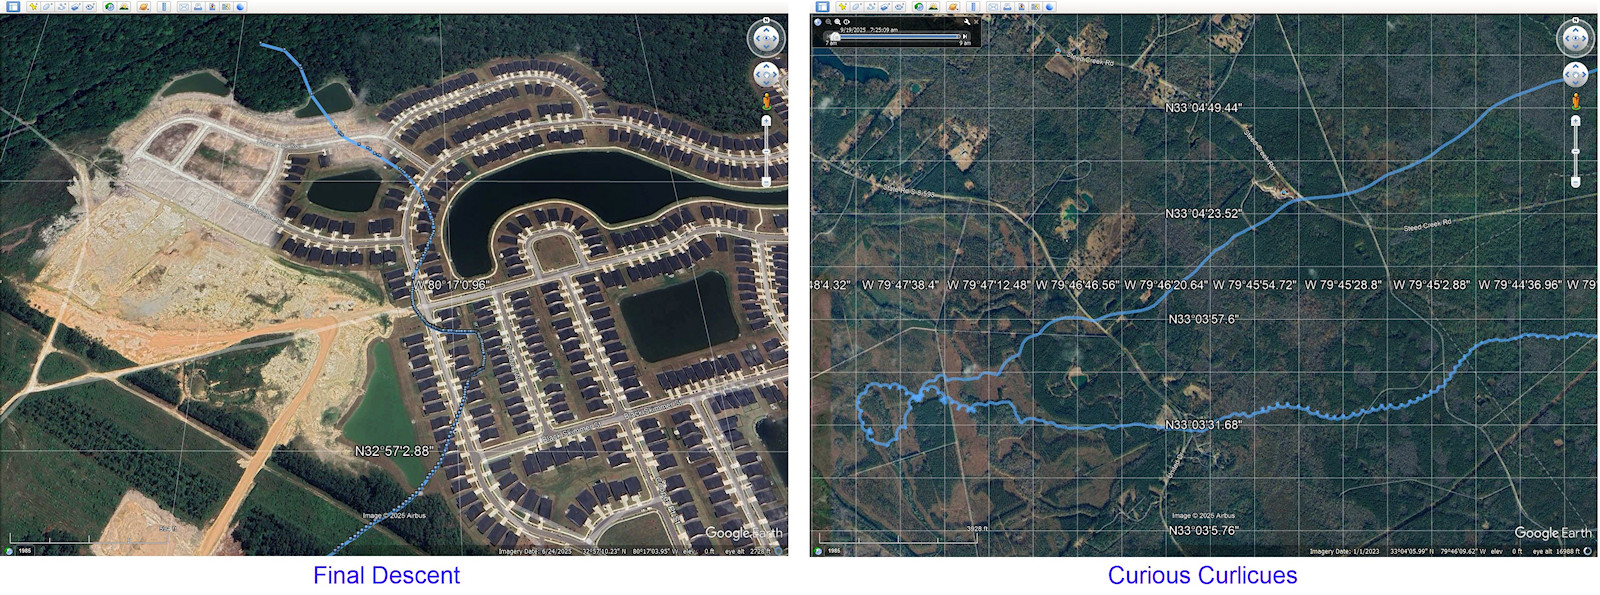
Off-line monitoring: The auto_rx
suite of applications includes a Flask
server. This allows application decodes to be examined separately from
sondehub.org’s
multi-station data. For example, using the browser interface to
auto_rx it was possible to note how low the balloon had descended when
the last parachute-phase decode was recorded. To my astonishment the
signal was sometimes successfully decoded when the elevation
angle was less than one degree, and the balloon at more
than 150 km distance from the receiver (illustration
below).
Logs and Utilities: Auto_rx is a robust
application. It recovers automatically
from
abnormal conditions, such as losing the balloon ID. (Perhaps this
feature could
be considered the “auto” part of the application name.) Auto_rx also
maintains
logs. A utility program that is part of the auto_rx suite converts log
track data to .kml format, suitable for
displaying in Google Earth Pro.
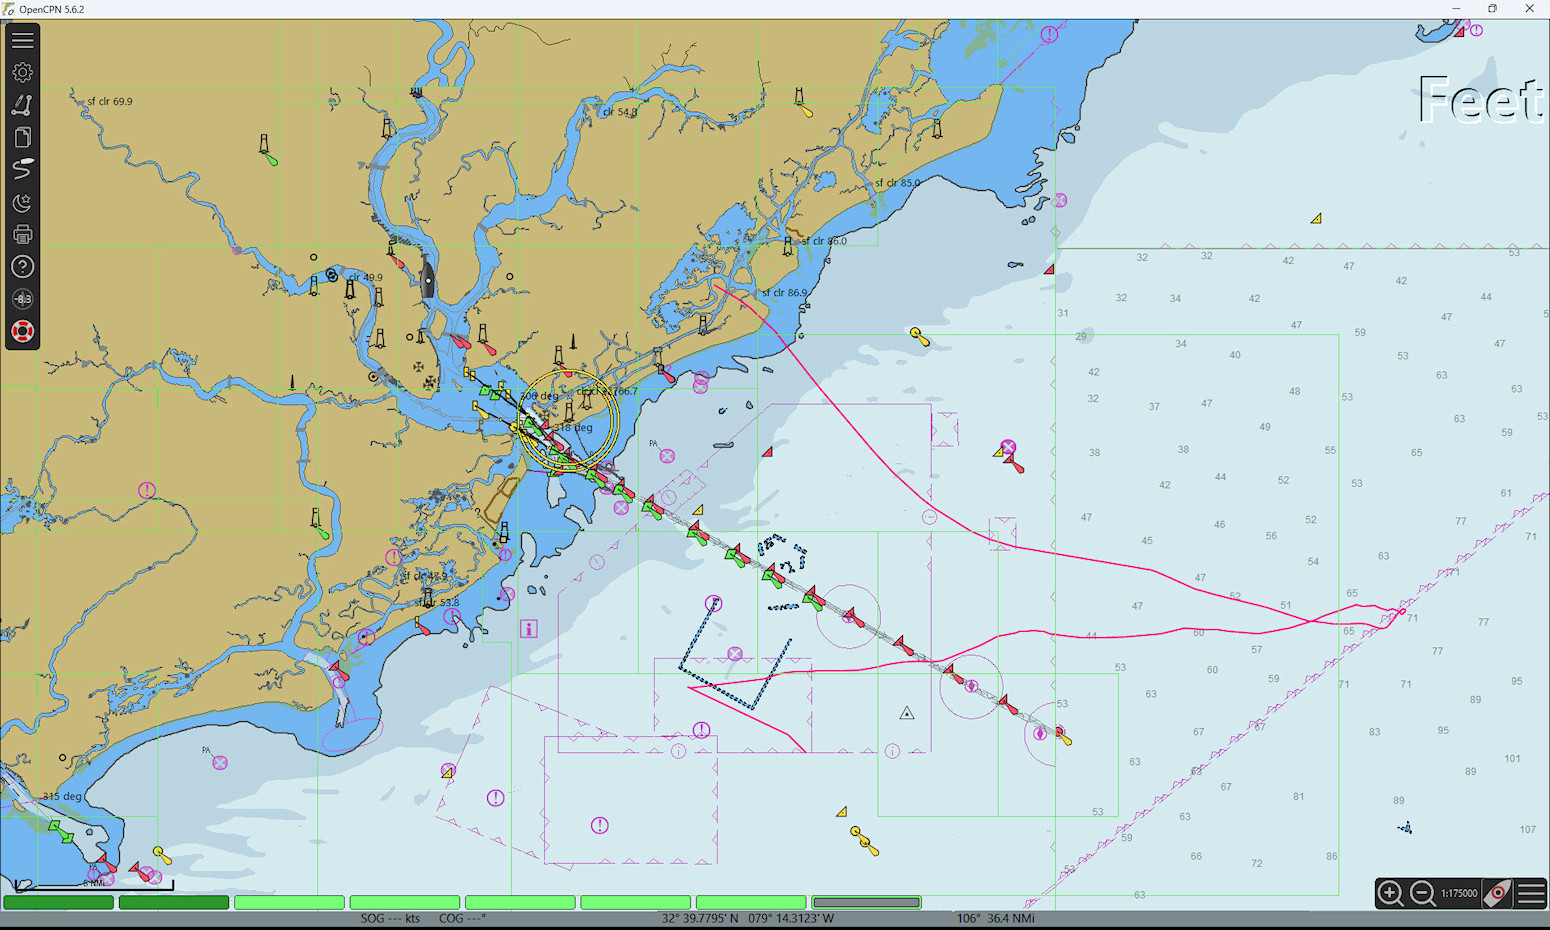
When
the weather changed, and the Charleston balloon began to meander
offshore, I thought it would be interesting to display its track on a
nautical
chart. However, the program that I use to render nautical charts did
not handle .kml format files. OpenCPN wanted GPS data, such as would be recorded
from a sailing vessel underway.
As the above screen capture shows, the attempt to
display auto_rx log data on a nautical chart eventually succeeded. For
compatiblity with OpenCPN, I created a small program that extracts lat/lon
data from log files to produce a .gpx
format track. Later the program was generalized to accept other file
input
formats, and to perform additional data analyses. These generalizations
will be described in a subsequent paragraph, along with
a link to download the software.
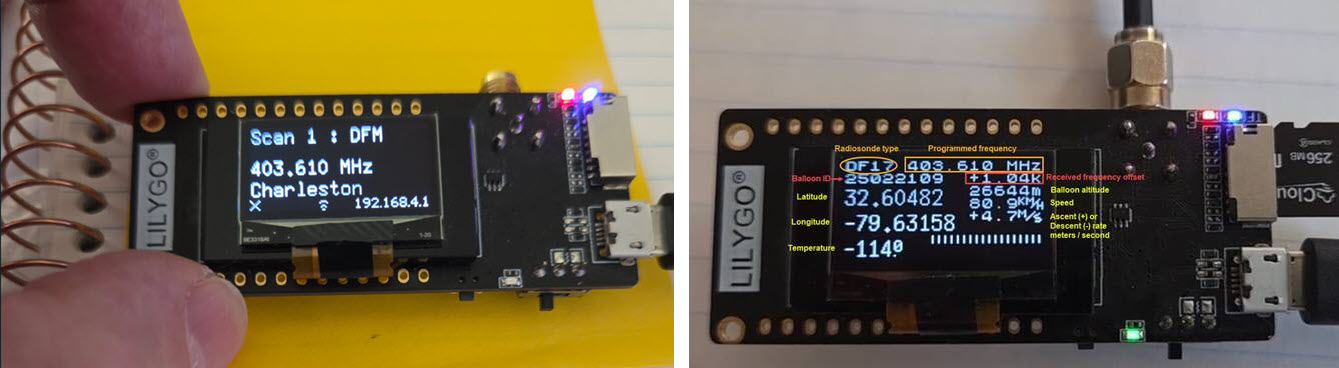
Onward and upward:
John (K4AXV), who introduced me to balloon tracking, gave me a small
LilyGo device, that was pre-programmed for the 433 MHz LoRa
band. It was similar in
appearance to this one from Amazon. He
told me that it would be possible to replace the pre-loaded 433 MHz
application with a
radiosonde frequency application. However, on first attempting to
change the firmware I bricked the
device, or thought I had. The tiny OLED screen went
permanently
dark. There was no response of any kind from the LilyGo. But then I
came upon an application developed by Hansi
Reiser, DL9RDZ, and
contributors.
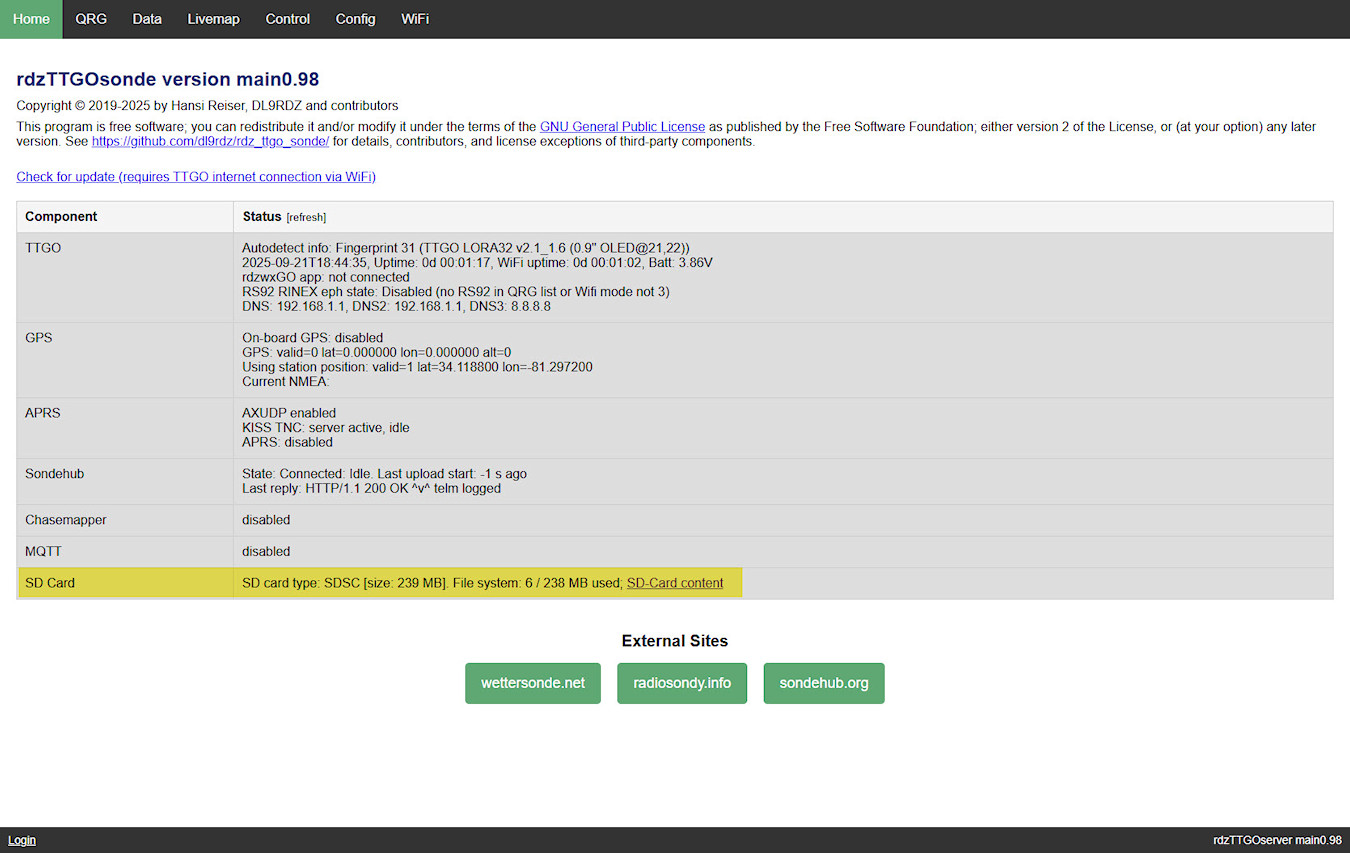
It is possible to flash the
DL9RDZ software directly from this web page to
the device, avoiding complexities of compiling and building. Upon
exercising this web-based flash process, the LilyGo came to life
again. The next steps were to configure the unit to be accessible from
the
home LAN, and to enable it for upload to sondehub, etc. All this
is documented, and for the most part intuitive. After the DL9RDZ
firmware has been loaded, the application first starts as a WiFi access
point, whereupon it can be customized and configured in whatever ways
are desired. (30-sec
video clip of LilyGo receiving and decoding)
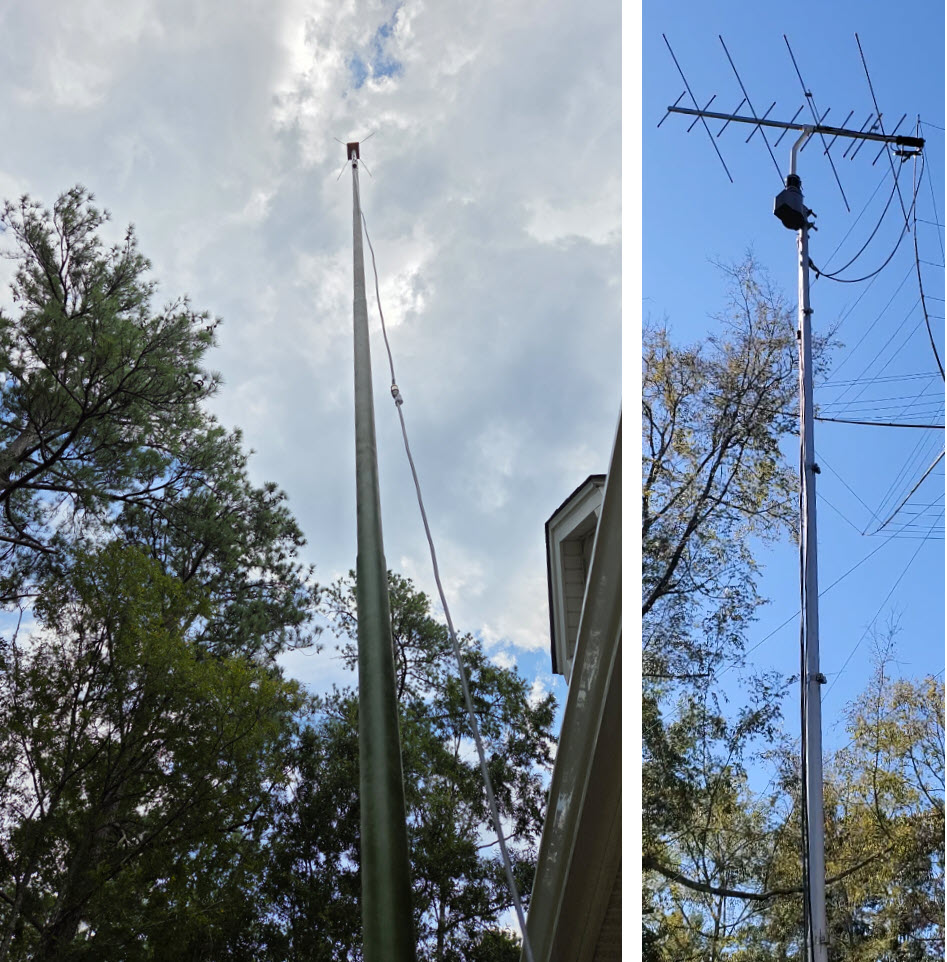
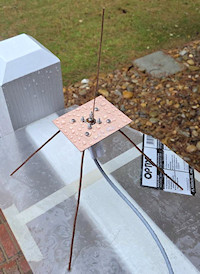
The LilyGo needed an antenna. In any case, I
was interested in experimenting with different antennas. The homebrew
ground plane had been elevated to about 25 feet (7.5 meters). I had
also tested a 70 cm Arrow antenna (satellite Yagi) that appeared
to
receive well on the US radiosonde band 400-406 MHz.
Antennas make a huge difference, of course. But even without a good
antenna, it is
possible to hear
the radiosonde. For example, the Charleston balloon can be heard
on a handheld with standard rubber-duck antenna, at a
distance of 150 km or more from my location: 30-second video + sound
clip here (full
antenna
view near end).
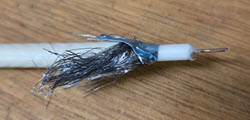
 For the LilyGo I made a collinear antenna from reclaimed
75
ohm cable TV coax.
Segment dimensions were computed using a
calculator at this page.
The same web page also includes useful
construction suggestions.
The main advantage of this coax is that its center conductor is copper
clad steel, thus very stiff and easy to insert between braid and outer
plastic sleeve, where sections join together. The shield consists of 4
parts, foil-braid-foil-braid, all aluminum.
For the LilyGo I made a collinear antenna from reclaimed
75
ohm cable TV coax.
Segment dimensions were computed using a
calculator at this page.
The same web page also includes useful
construction suggestions.
The main advantage of this coax is that its center conductor is copper
clad steel, thus very stiff and easy to insert between braid and outer
plastic sleeve, where sections join together. The shield consists of 4
parts, foil-braid-foil-braid, all aluminum.
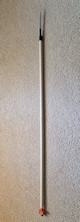
My first version
consisted of four quarter-wave sections, but John
(K4AXV) had constructed a similar antenna with half-wave middle
sections for theoretically better gain, so I did the same in a rebuild.
The optional top wire is a ¼ wave length
telescoping whip. My intention was to adjust
the whip length for optimal reception, however, I couldn’t
tell any difference by ear on moving the telescoping part in or out a
little. The collinear (enclosed in a length of ½-inch CPVC
tubing) was raised on a pulley to just below the ground plane on the
same mast. Performance varies—occasionally it is better, but more often
a
little worse than the ground plane.
The LilyGo with
collinear presently identifies its uploads to sondehub.org as station
WA4EFS-1. One
difference from the auto_rx setup is that DL9RDZ’s rdzTTGOsonde
application
reports absolute signal levels in dBm, rather
than SNR. Interestingly,
the sondehub.org “Plots” feature includes a separate graph labeled
“RSSI” for rdzTTGOsonde dBm data. Absolute signal level is a
function of many factors, and maybe challenging to interpret usefully.
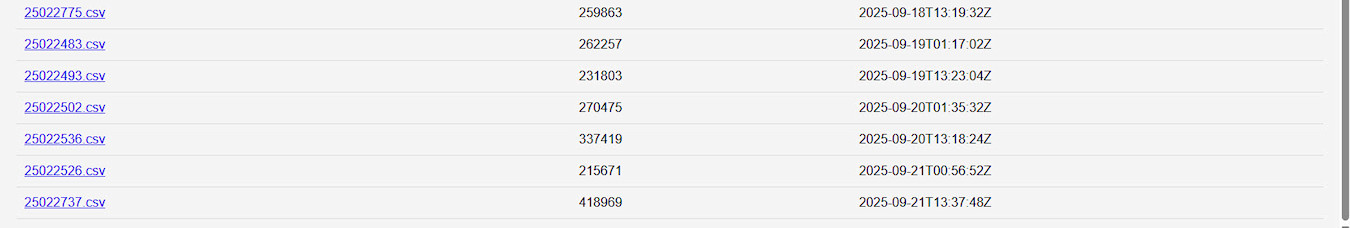
The
LilyGo also has an SD card slot where it can record Excel format log
files. I happened to have a supply of low-capacity microSD cards (128
or 256 MB). These are a good size for storing a few hundred fractional
MB .csv files.
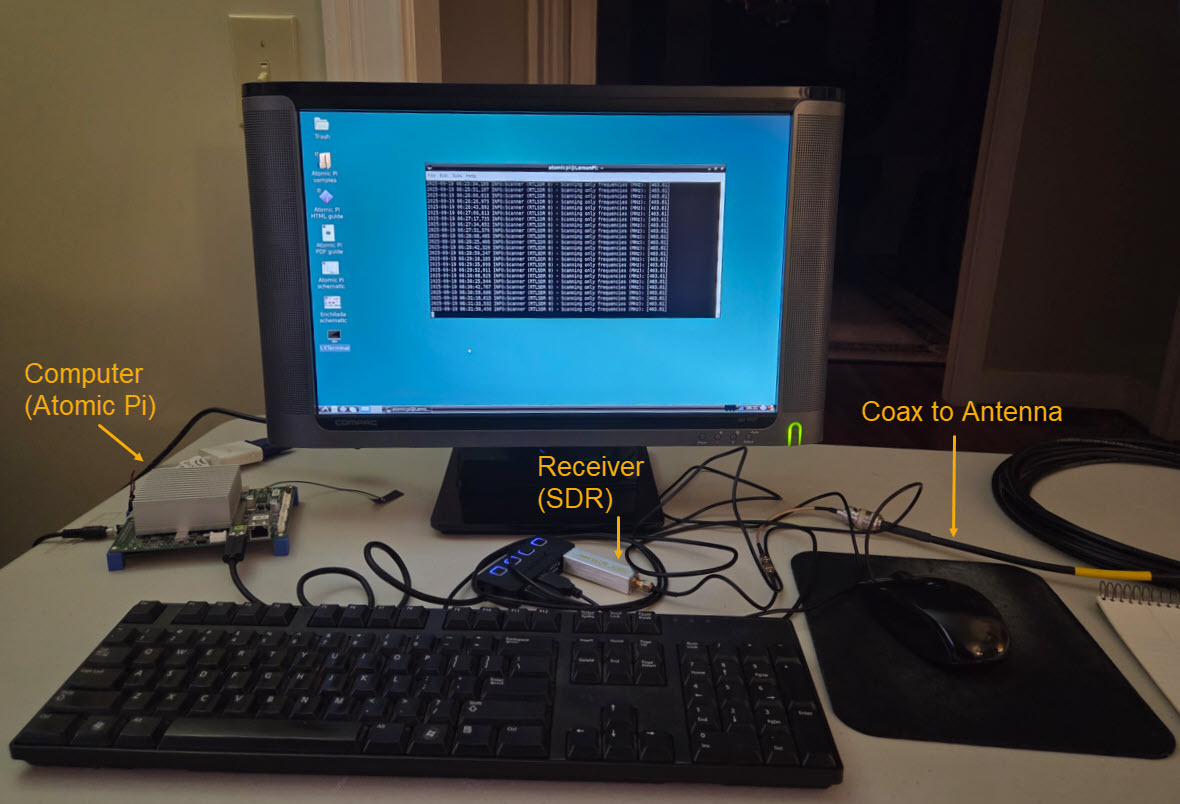
Second auto_rx
station:
Another Pi was available to host a second installation of auto_rx. I
also had another RTL-SDR on hand, one that was used in last year’s NOAA
GOES project. Once these components were assembled, there were
three
receiving stations with separate antennas, each capable of uploading
telemetry packets to sondehub.org. Things were
becoming rather messy.
The third station identifies as WA4EFS-2. To avoid confusion,
receiver-antenna combinations needed to
be nailed-down, each with a “permanent” station identifier. At present,
and it is hoped the scheme will hold, WA4EFS is the Yagi, WA4EFS-1
(LilyGo) the collinear, and WA4EFS-2 (above photo) the ground plane.
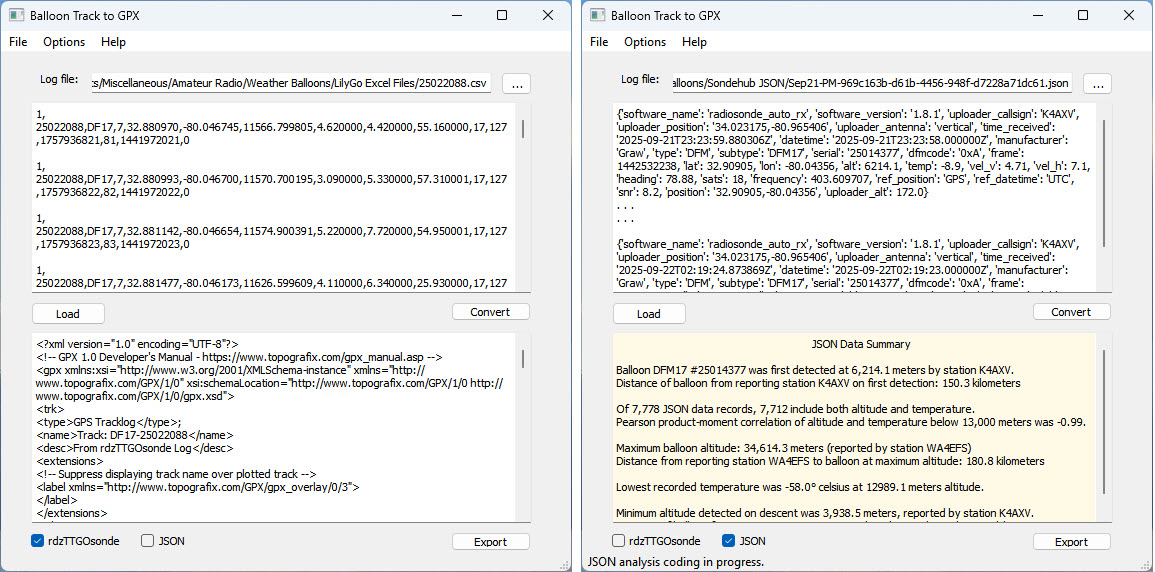
Plotting and Analysis: In truth there's not much to be
done that hasn't already been done very well at sondehub.org. A
previous
paragraph and illustration describes plotting an offshore balloon track
on a nautical chart. The left illustration above shows conversion of a
LilyGo .csv file to GPX format, while the right illustration shows the
application’s “Analysis” option. The latter came about because I had to
think of something to do with the application other than converting
track
data.
The Python program converts 3 types of input file to
.gpx (auto_rx log, LilyGo .csv, and Sondehub JSON). The program’s
source code may be examined or downloaded here. I
have had only minimal experience with Python programming. Qt Designer was used to layout the GUI. Thus the
Python source depends on Qt modules (imports) that must be separately
downloaded in order to run the application from source. As an
alternative, this zip download contains a PyInstaller-generated
Windows executable with dependencies included (52 MB). Unzip and create a
convenience shortcut to the executable, if desired.
Improvement:
(December 2025) I have learned how to make a standalone executable from
a Qt Designer-dependent Python source, thanks to this useful advice.
Also, the ‘Balloon Track Converter’ has been enhanced to include a JSON
log tabular anslysis option. The executable may be downloaded by
right-clicking and saving exe download. The current revision also displays a build number in the title bar, in case something else gets added later.
The ham radio hobby appeals to “weak signal”
interests in multiple ways, QRP, QRPp, beacons, digital modes, meteor
scatter, earth-moon-earth, and others that don’t spring to mind at the
moment. In addition, amateur radio astronomy, which might
be regarded as another weak-signal mode, intersects
productively with ham radio. Unfortunately, I do not have the requisite
meteorological knowledge to analyze radiosonde data (e.g., temperature
or wind speed and direction versus altitude) in
a way that would relate to scientific weather forecasting. For me the
main point of this project was to learn how to detect and track a
weather balloon’s weak signal from a significant distance away, and to
have fun doing so.
Endnotes
1. A few years before hearing this chance lunch
conversation,
Alex DD5ZZ had told me about tracking weather balloons in Germany.
However, it did not occur to me at the time that similar balloons might
also be launched within radio range of my South Carolina, USA location!
Interestingly, US radiosondes—the ones currently in use—are of a
different type than are used in Europe.
Project descriptions on this page are intended for entertainment only.
The author makes no claim as to the accuracy or completeness of the
information presented. In no event will the author be liable for any
damages, lost effort, inability to carry out a similar project, or to
reproduce a claimed result, or anything else relating to a decision to
use the information on this page.